Sunday
Jun132010
Check out this crazy footage of silver carp!
I guess they don't like the electrofisher much...
I guess they don't like the electrofisher much...

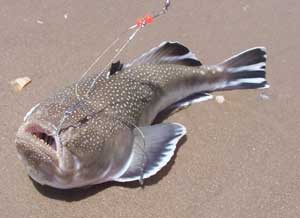 We have a new face in the BoC winners circle this week. Sarah F. correctly identified the critter from round 21 as a stargazer. That's a pretty impressive effort, because I didn't give you much to go on. If you've never met one before, stargazers are bottom-dwelling fish that are the consummate lie-in-wait predator. And when I say bottom-dwelling, I mean IN the bottom. Usually all you can see is the grumpy looking eyes and mouth, both of which have migrated to the top of the head over evolutionary time, because they bury the rest in sand for camouflage. They are not related to flounder or other flatfishes, though, which becomes abundantly clear if one ever leaves the sand to hit a passing bait or fishing lure; no, they are a beefy bulldog of a fish. The other important difference from flatfishes is that the eyes and mouth are truly on the top of the stargazer's head, whereas the eyes of flounder have both migrated to one side of the head (this process can be seen during development) and the mouth remains terminal.
I was inspired by recent articles highlighting a revised calculation of the ocean’s average depth as 12,081ft, to consider the seas in a numerical light today. To that end, here’s a few random, sourced numbers and back-of-the-envelope calculations that might be food for thought:
0.87% = Amount we can see by diving from the surface (about 100ft) over the average depth
0.28% = Amount we can see by diving over the deepest part (Challenger Deep, Marianas Trench off the Philippines)
2.9 = Number of times deeper the deepest part is, compared to the average.
5,400 = Number of mammal species in the world
25,000 = Number of fish species in the world
Millions? = Number of marine invertebrates species in the world (no-one really knows)
2.3 Million = The number of US citizens directly dependent on ocean industries (source: NOAA)
$117 Billion = Value of ocean products and services to the US economy (yr 2000, source: NOAA)
50% = US population living in coastal zones
48% = The proportion of all human-produced CO2 absorbed by the oceans in the Industrial era (NatGeo)
0.1 = The pH drop in the surface oceans since 1900
0.35 = Expected pH drop by 2100 (source)
18 = The number of times more heat absorbed by the oceans than the atmosphere since 1950 (source - TAMU). Global warming is an ocean process far more than an atmospheric one.
3.5 Million = Estimated tons of plastic pollution circling in the Great Pacific Garbage Patch, and growing.
And yet:
30 = Number of times thicker the atmosphere is (out to the “edge of space” about 60 miles) than the average ocean. That would be the atmosphere that astronauts describe as a “thin veneer” on the planet…
0.06% = Thickness of the average ocean, compared to the radius of the earth. I think we can argue that the water is the veneer, not the air
$4.48 Billion = NOAA’s 2010 budget, including the National Ocean Service, Weather Service and Fisheries Services. (source NOAA)
$18.7 Billion = NASA’s 2010 budget, i.e. 4 times the size of the agency that looks after our own planet (source NASA)
$664 Billion = Department of Defense base budget 2010, not counting special allocations (source DoD)
0.6% = The amount you would need to cut Defense in order to double the NOAA budget
Some sources:
http://www.corporateservices.noaa.gov/~nbo/FY10_BlueBook/NOAAwide_One_Pager051109.pdf
http://www.corporateservices.noaa.gov/~nbo/10bluebook_highlights.html http://news.nationalgeographic.com/news/2004/07/0715_040715_oceancarbon_2.html
http://oceanworld.tamu.edu/resources/oceanography-book/oceansandclimate.htm
http://web.archive.org/web/20080625100559/http://www.ipsl.jussieu.fr/~jomce/acidification/paper/Orr_OnlineNature04095.pdf
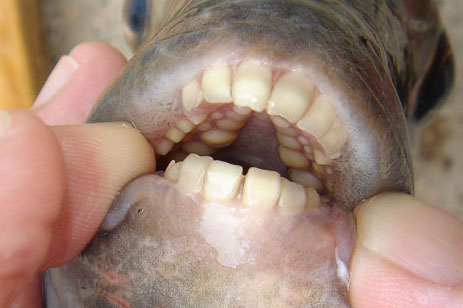
![]() Baddum-tish! OK, they don't chew their cud, but I can never resist a good pun (although I was seriously considering "Ruminations on the way fish eat" - better?). I just love this new paper by Gintof et al. about how fish chew, mostly because its an idea that I never would have ever considered. Basically, they explored whether fish just bolt their food, like lizards and snakes, or whether they engage in "intra-oral prey processing" (= chewing, sometimes sicnetific jargon cracks me up). After looking at several model fish species, they conclude that yes, fish chew, and they chew about as many times as mammals do. Its not like mammal chewing (especially herbivores) in that there is little side-to-side motion, but its rhythmic, and thats the most important thing. This means that the bolting of food by lizards and snakes represents evolutionary loss of chewing, or that the model fish and all mammals both evolved chewing separately (they call this convergent evolution).
Baddum-tish! OK, they don't chew their cud, but I can never resist a good pun (although I was seriously considering "Ruminations on the way fish eat" - better?). I just love this new paper by Gintof et al. about how fish chew, mostly because its an idea that I never would have ever considered. Basically, they explored whether fish just bolt their food, like lizards and snakes, or whether they engage in "intra-oral prey processing" (= chewing, sometimes sicnetific jargon cracks me up). After looking at several model fish species, they conclude that yes, fish chew, and they chew about as many times as mammals do. Its not like mammal chewing (especially herbivores) in that there is little side-to-side motion, but its rhythmic, and thats the most important thing. This means that the bolting of food by lizards and snakes represents evolutionary loss of chewing, or that the model fish and all mammals both evolved chewing separately (they call this convergent evolution).
Its a fun paper, you can read it here:
Gintof C, Konow N, Ross CF, and Sanford CP (2010). Rhythmic chewing with oral jaws in teleost fishes: a comparison with amniotes. The Journal of experimental biology, 213 (Pt 11), 1868-75 PMID: 20472774
As Akira so succinctly put it - Euthynnus alletteratus. To the rest of us, that's the little tunny. In his follow-up, Aki pointed out that the spots below the pectoral fin were the give away - no other tuna has them.

![]() Disease is a funny old thing. We're taught from very early on that disease agents are "bad" and that, by contrast, the infected are somehow poor and unfortunate victims of nasty evil bugs. This is clearly a cultural bias, wherein we project our own concerns about getting sick onto all other animals; there's no real reason to think that a bacterium or virus has any less right to be here or any less important role in the ecological processes of the world than does the dolphin it infects, or the fish or the lobster. We have all survived eons while avoiding extinction, which makes us winners in the great game of evolution, the microbes every bit as much (or more) than their hosts.
Disease is a funny old thing. We're taught from very early on that disease agents are "bad" and that, by contrast, the infected are somehow poor and unfortunate victims of nasty evil bugs. This is clearly a cultural bias, wherein we project our own concerns about getting sick onto all other animals; there's no real reason to think that a bacterium or virus has any less right to be here or any less important role in the ecological processes of the world than does the dolphin it infects, or the fish or the lobster. We have all survived eons while avoiding extinction, which makes us winners in the great game of evolution, the microbes every bit as much (or more) than their hosts.

These days, disease studies are becoming a lot more nuanced, and its revealing a whole new world of how diseases start and stop. Rocco Cipriano, a microbiologist colleague of mine at the National Fish Health Labs in Leetown WV, has been promoting a model lately where an infectious disease of fish (furunculosis) is caused by a disruption to the natural community of bacteria on the skin of fish; a community in which pathogens have no place normally. The furunculosis agent (Aeromonas) is excluded from these communities by bacteria better adapted to living in normal fish skin and its associated mucus layer. That is, until an environmental modulator, like a temperature spike or pollutant, shakes things up a bit; what ecologists would call disturbance. And what is the first outcome of disturbance in most systems? Loss of diversity, in this case among the normal bacterial community. Some bacteria disappear from the skin of the fish, freeing up resources (space, food) that are exploited by other bacteria - opportunists that can come in and pounce on the new space or food. When that space and food consists of the fish itself, we call those bacteria pathogens. This same process happens after any ecological disturbance, like a hurricane on a reef or a tree falling in a rainforest: opportunists come in and pounce on a newly-available resource; then as things settle down a succession takes place, until the early colonisers are displaced by more typical fauna. In this view, disease is nothing more than a byproduct of disturbance and loss of diversity in the normal microbial community.
Which brings me back to corals and to the recent paper by Mao-Jones and colleagues in PLoS Biology. These folks used a mathematical model to show that much the same holds true for the diseases of corals, which, like fish, rely heavily on a surface layer of mucus as their first line of defence. It seems that in both corals and fish, the mucus is important, but even more important are the normal bacteria that live there, continually excluding pathogens and acting as a protective guard against disease. In a very anthropomorphic sense, the corals (and fish) are using the surface bacteria as a biological weapon against the potential pathogens, at the expense of having to produce all that mucus for the bacteria to live and feed on. Importantly, Mao-Jones and friends show us that the derangement of the mucus community can persist for a really long time after the initial disturbance. This is important, because you often come along and see disease starting, but you may well have missed the initial insult that got the ball rolling, which may have occurred some time ago.
I really like this idea of infectious disease as an ecological disturbance and of many pathogens as simply early colonisers in the succession back towards health (or towards death, if the disturbance was too severe). As a model, it doesn't work for everything, though. There are many "primary pathogens" that are specifically adapted to invade healthy animals, but its not in the best interests of those organisms to invest so much energy in adaptations to invasion, only to kill the host, thus many of those are fairly benign. For more "opportunistic" agents, however, I suspect it holds true much of the time, and that group includes many or most of the really virulent diseases. I dare say many of the "emerging" diseases fall in this category, and we can expect to see more of this as the global climate continues to tilt the tango in favour of the pathogens.
Mao-Jones, J., Ritchie, K., Jones, L., & Ellner, S. (2010). How Microbial Community Composition Regulates Coral Disease Development PLoS Biology, 8 (3) DOI: 10.1371/journal.pbio.1000345
 Post a Comment | Email Article | tagged
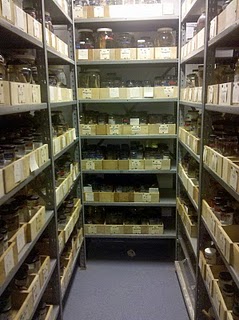
It was a long but fantastic day at the Museum yesterday. After Bento boxes with the grad studets, I met with folks from their comparative genomics and conservation genetics group including George Amato and Rob deSalle. Then out for refreshments with the leech lab folks and their intrepid leader and old colleague of mine Mark Siddall. We gasbagged about everything from progressive metal to the latest leech they described, Tyranobdella rex, from up the nose of an unfortunate Peruvian child. What an awesome name. You can read more about it on Mark's blog Bdella Nea, linked from my blog roll somewhere hereabouts.
I didn't get to do everything on the agenda yesterday, so its back to the museum today to meet with people from Ichthyology and take a look at the fish type collection (drool). I might just snag some bit-o-critter pics from among the jars...
Hi folks,
Round 5 of bit-o-critter was the most competitive yet. Eventually Akira triumphed, recognising the sarcastic fringehead, Neoclinus blanchardi, which is a relative of the blennies, that lives in the cold waters of the Pacific northwest. If you've watched Life on Discovery, you may recognise this fish from an awesome sequence they had of fringeheads fighting. Here's some other footage from YouTube of the same.
Like I said, it's weird that a fish with such a ridiculously large mouth gets named after some wussy little fringes on its head. Perhaps that was the sarcastic bit...

![]() A little while back I wrote about how we can use Species Accumulation Curves to learn stuff about the ecology of animal, as well as to decide when we can stop sampling and have a frosty beverage. There’s a timely paper in this month’s Journal of Parasitology by Gerardo Pérez-Ponce de Leon and Anindo Choudhury about these curves (let’s call them SACs) and the discovery of new parasite species in freshwater fishes in Mexico. Their central question was not “When can we stop sampling and have a beer?” so much as “When will we have sampled all the parasites in Mexican freshwaters?”. They conclude, based on “flattening off” of their curves (shown below, especially T, C and N), that researchers have discovered the majority of new species for many major groups of parasites and that we can probably ease up on the sampling.
A little while back I wrote about how we can use Species Accumulation Curves to learn stuff about the ecology of animal, as well as to decide when we can stop sampling and have a frosty beverage. There’s a timely paper in this month’s Journal of Parasitology by Gerardo Pérez-Ponce de Leon and Anindo Choudhury about these curves (let’s call them SACs) and the discovery of new parasite species in freshwater fishes in Mexico. Their central question was not “When can we stop sampling and have a beer?” so much as “When will we have sampled all the parasites in Mexican freshwaters?”. They conclude, based on “flattening off” of their curves (shown below, especially T, C and N), that researchers have discovered the majority of new species for many major groups of parasites and that we can probably ease up on the sampling.
Trying to wrap your arms (and brain) around an inventory of all the species in a group(s) within a region is a daunting task, and I admire Pérez-Ponce de Leon and Choudhury for trying it, but I have some problems with the way they used SACs to do it, and these problems undermine their conclusions somewhat.
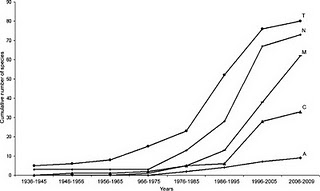
OK, so what do the graphs in this paper actually tell us? Well, without an actual measure of effort, not much, unfortunately; perhaps only that there was a hey-day for Mexican fish parasite discovery in the mid-1990’s. It is likely, maybe even probable, that this pattern represents recent changes in sampling effort, more than any underlying pattern in biology. More importantly, perhaps, the apparent flattening off of the curves (not all that convincing to me anyway), which they interpret to mean that the rate of discovery is decreasing, may be an illusion. I bet there are tons of new parasite species yet to discover in Mexican rivers and lakes, but without a more comprehensive analysis, it’s impossible to tell for sure.
There is one thing they could have done to help support their conclusion. If they abandoned the time series and then made an average curve by randomizing the order of years on the x-axis a bunch of times, that might tell us something; this would be a form of rarefaction. The averaging process will smooth out the curve, giving us a better idea of when, if ever, they flatten off, and thereby allowing a prediction of the total number of species we could expect to find if we kept sampling forever. Sometimes that mid-90’s increase will occur early in a randomised series, sometimes late, and the overall shape for the average curve will be the more “normal” concave-down curve from my previous post, not the S-shape that they found. After randomizing, their x-axis would no longer be a “calendar” time series, just “years of sampling” 1, 2, 3… etc. There's free software out there that will do this for you: EstimateS by Robert Colwell at U.Conn.
The raw material is there in this paper, it just needs a bit more work on the analysis before they can stop sampling and have their cervezas.
Perez-Ponce de León, G. and Choudhury, A. (2010). Parasite Inventories and DNA-based Taxonomy: Lessons from Helminths of Freshwater Fishes in a Megadiverse Country Journal of Parasitology, 96 (1), 236-244 DOI: 10.1645/GE-2239.1
In this thread I want to hear about field locations YOU have loved, and WHY. Here's a couple of mine to get the ball rolling:
 Kedron Brook, Brisbane, Australia. A choked little stretch of suburban creek on the north east side of Brisbane Australia was a key field location for my PhD research, which was all about introduced (exotic) species and their parasites in rivers and streams in Australia. At one point just above the tidal influence - stylishly named KB216 for its map reference - this creek is basically completely exotic: plants, invertebrates, fish, the whole shebang. There aren't many parasites there, but those that were present were introduced hitchhikers. Not sexy, but a veritable Shangri-La for a student on the hunt for ferals...
In the comments, tell us about a field location YOU have loved and why. Post links if you can find them.
3 Comments | Email Article | tagged The aristocratic bunquelovely, Symphysanodon typus


